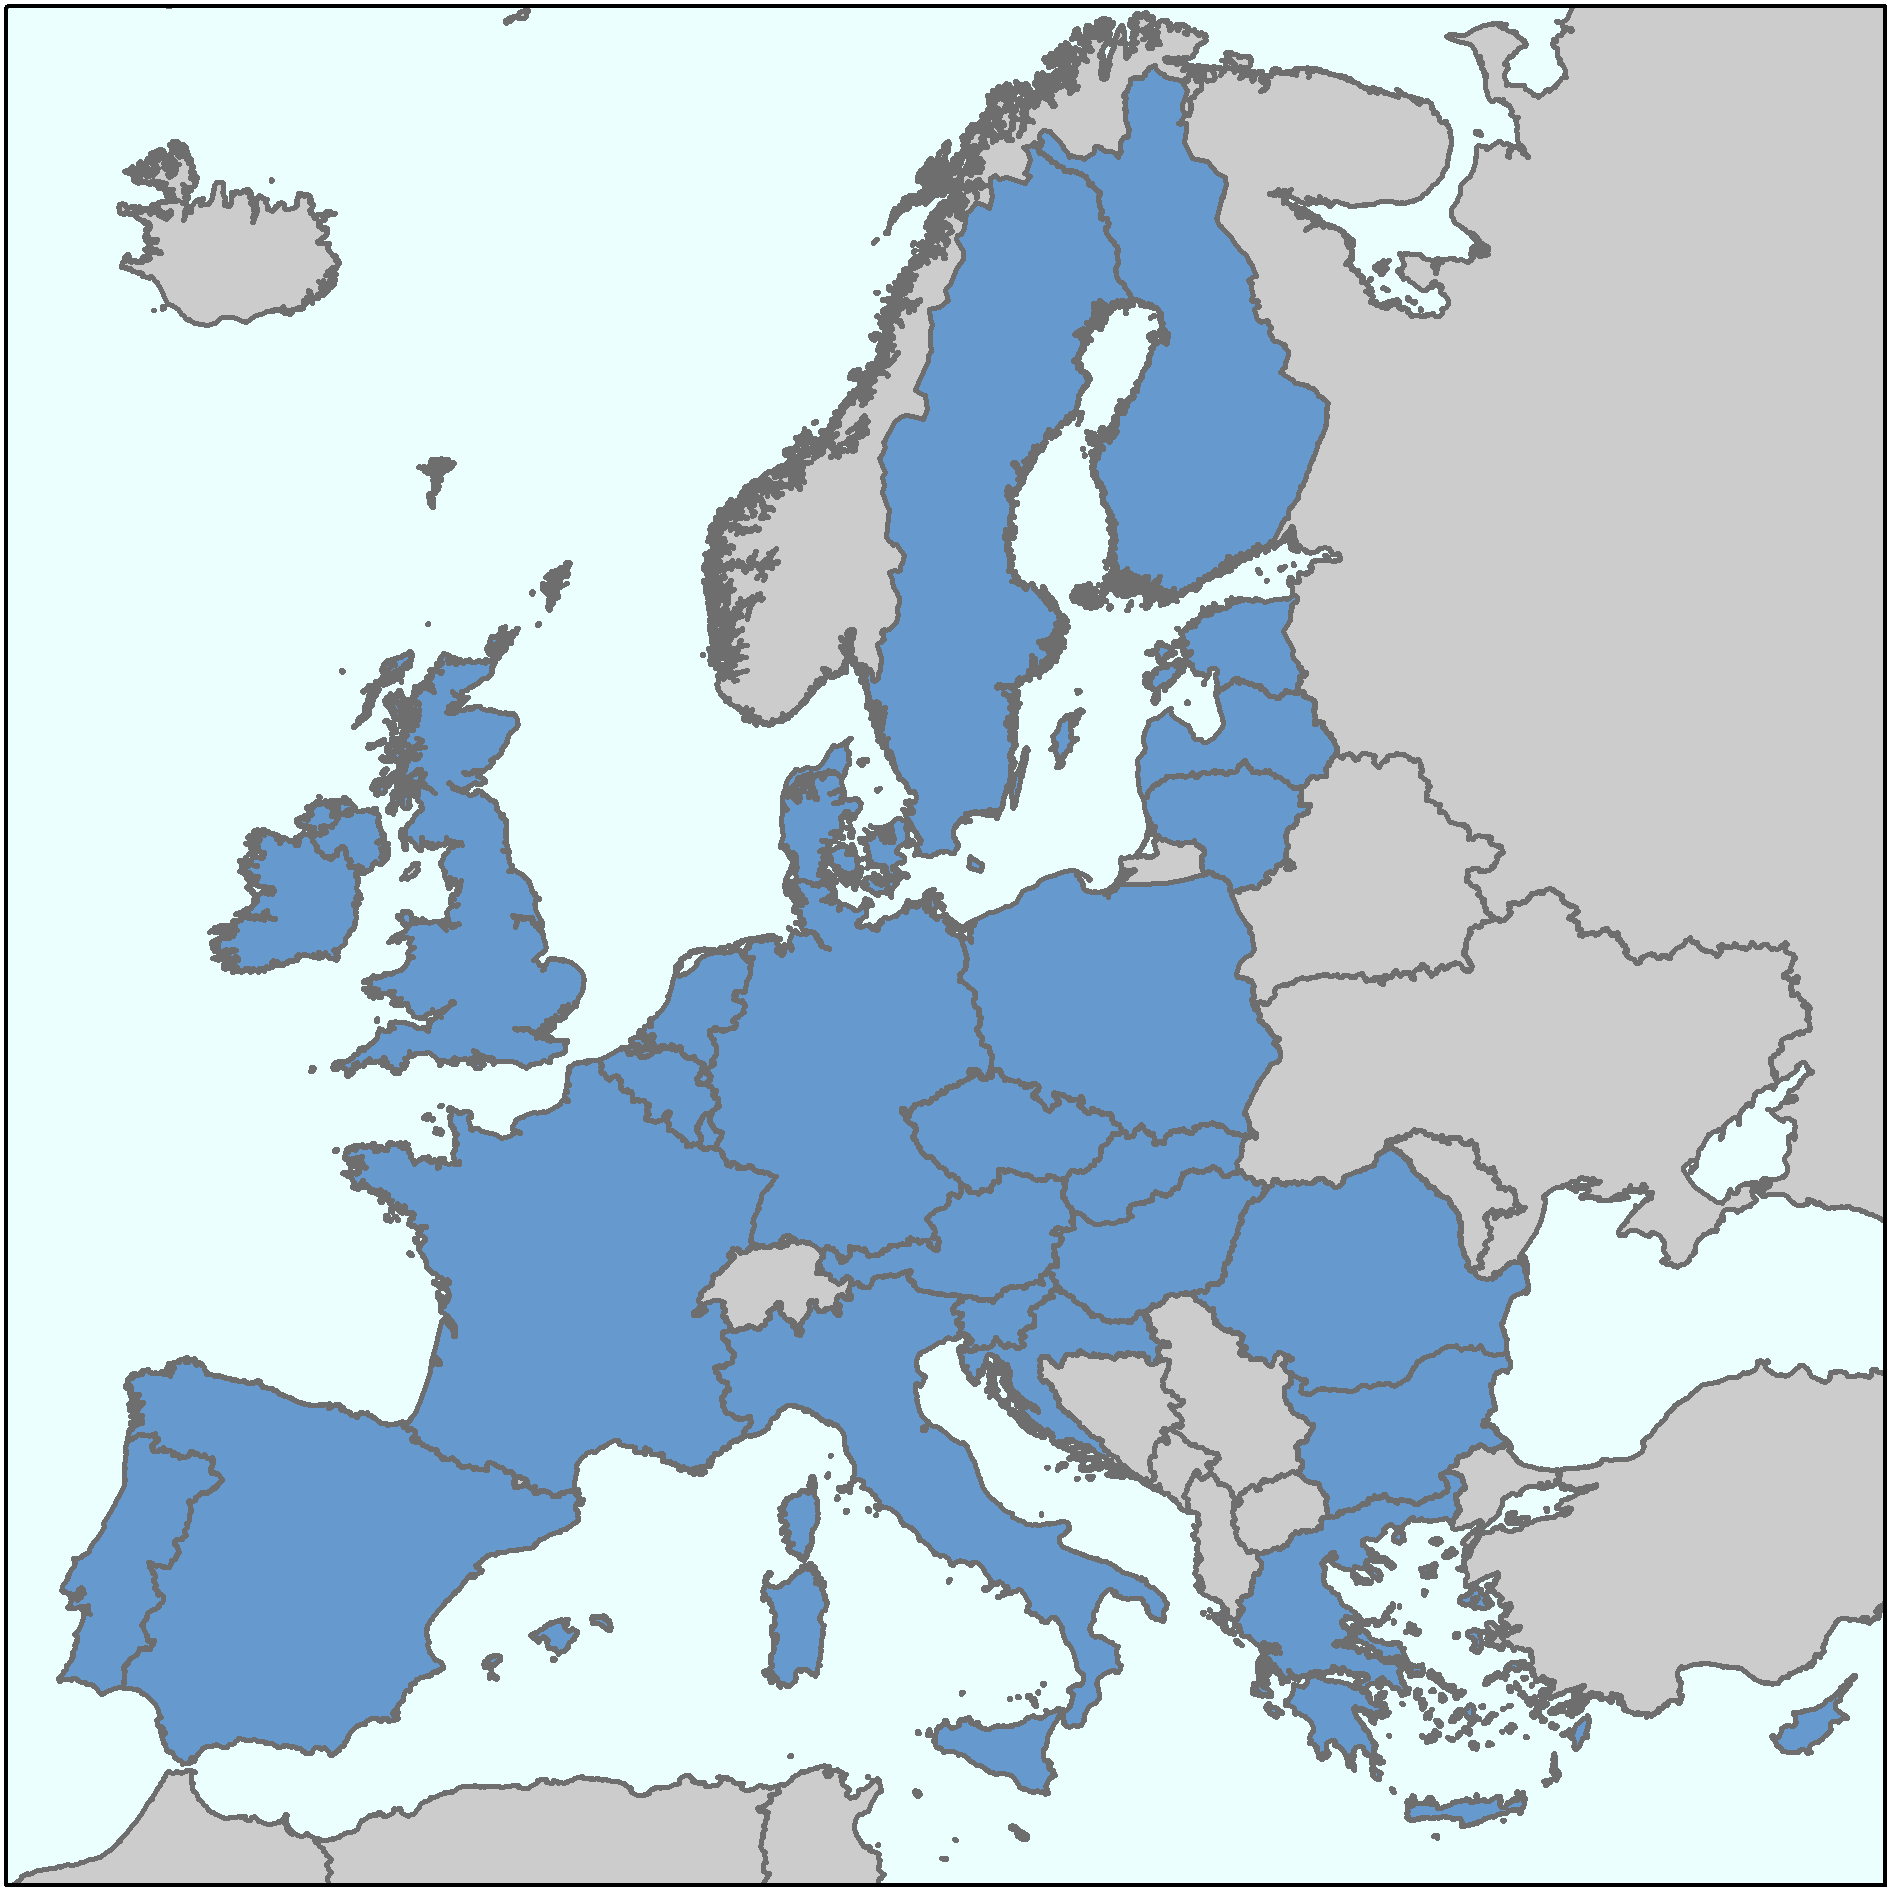
 FIRST SALE
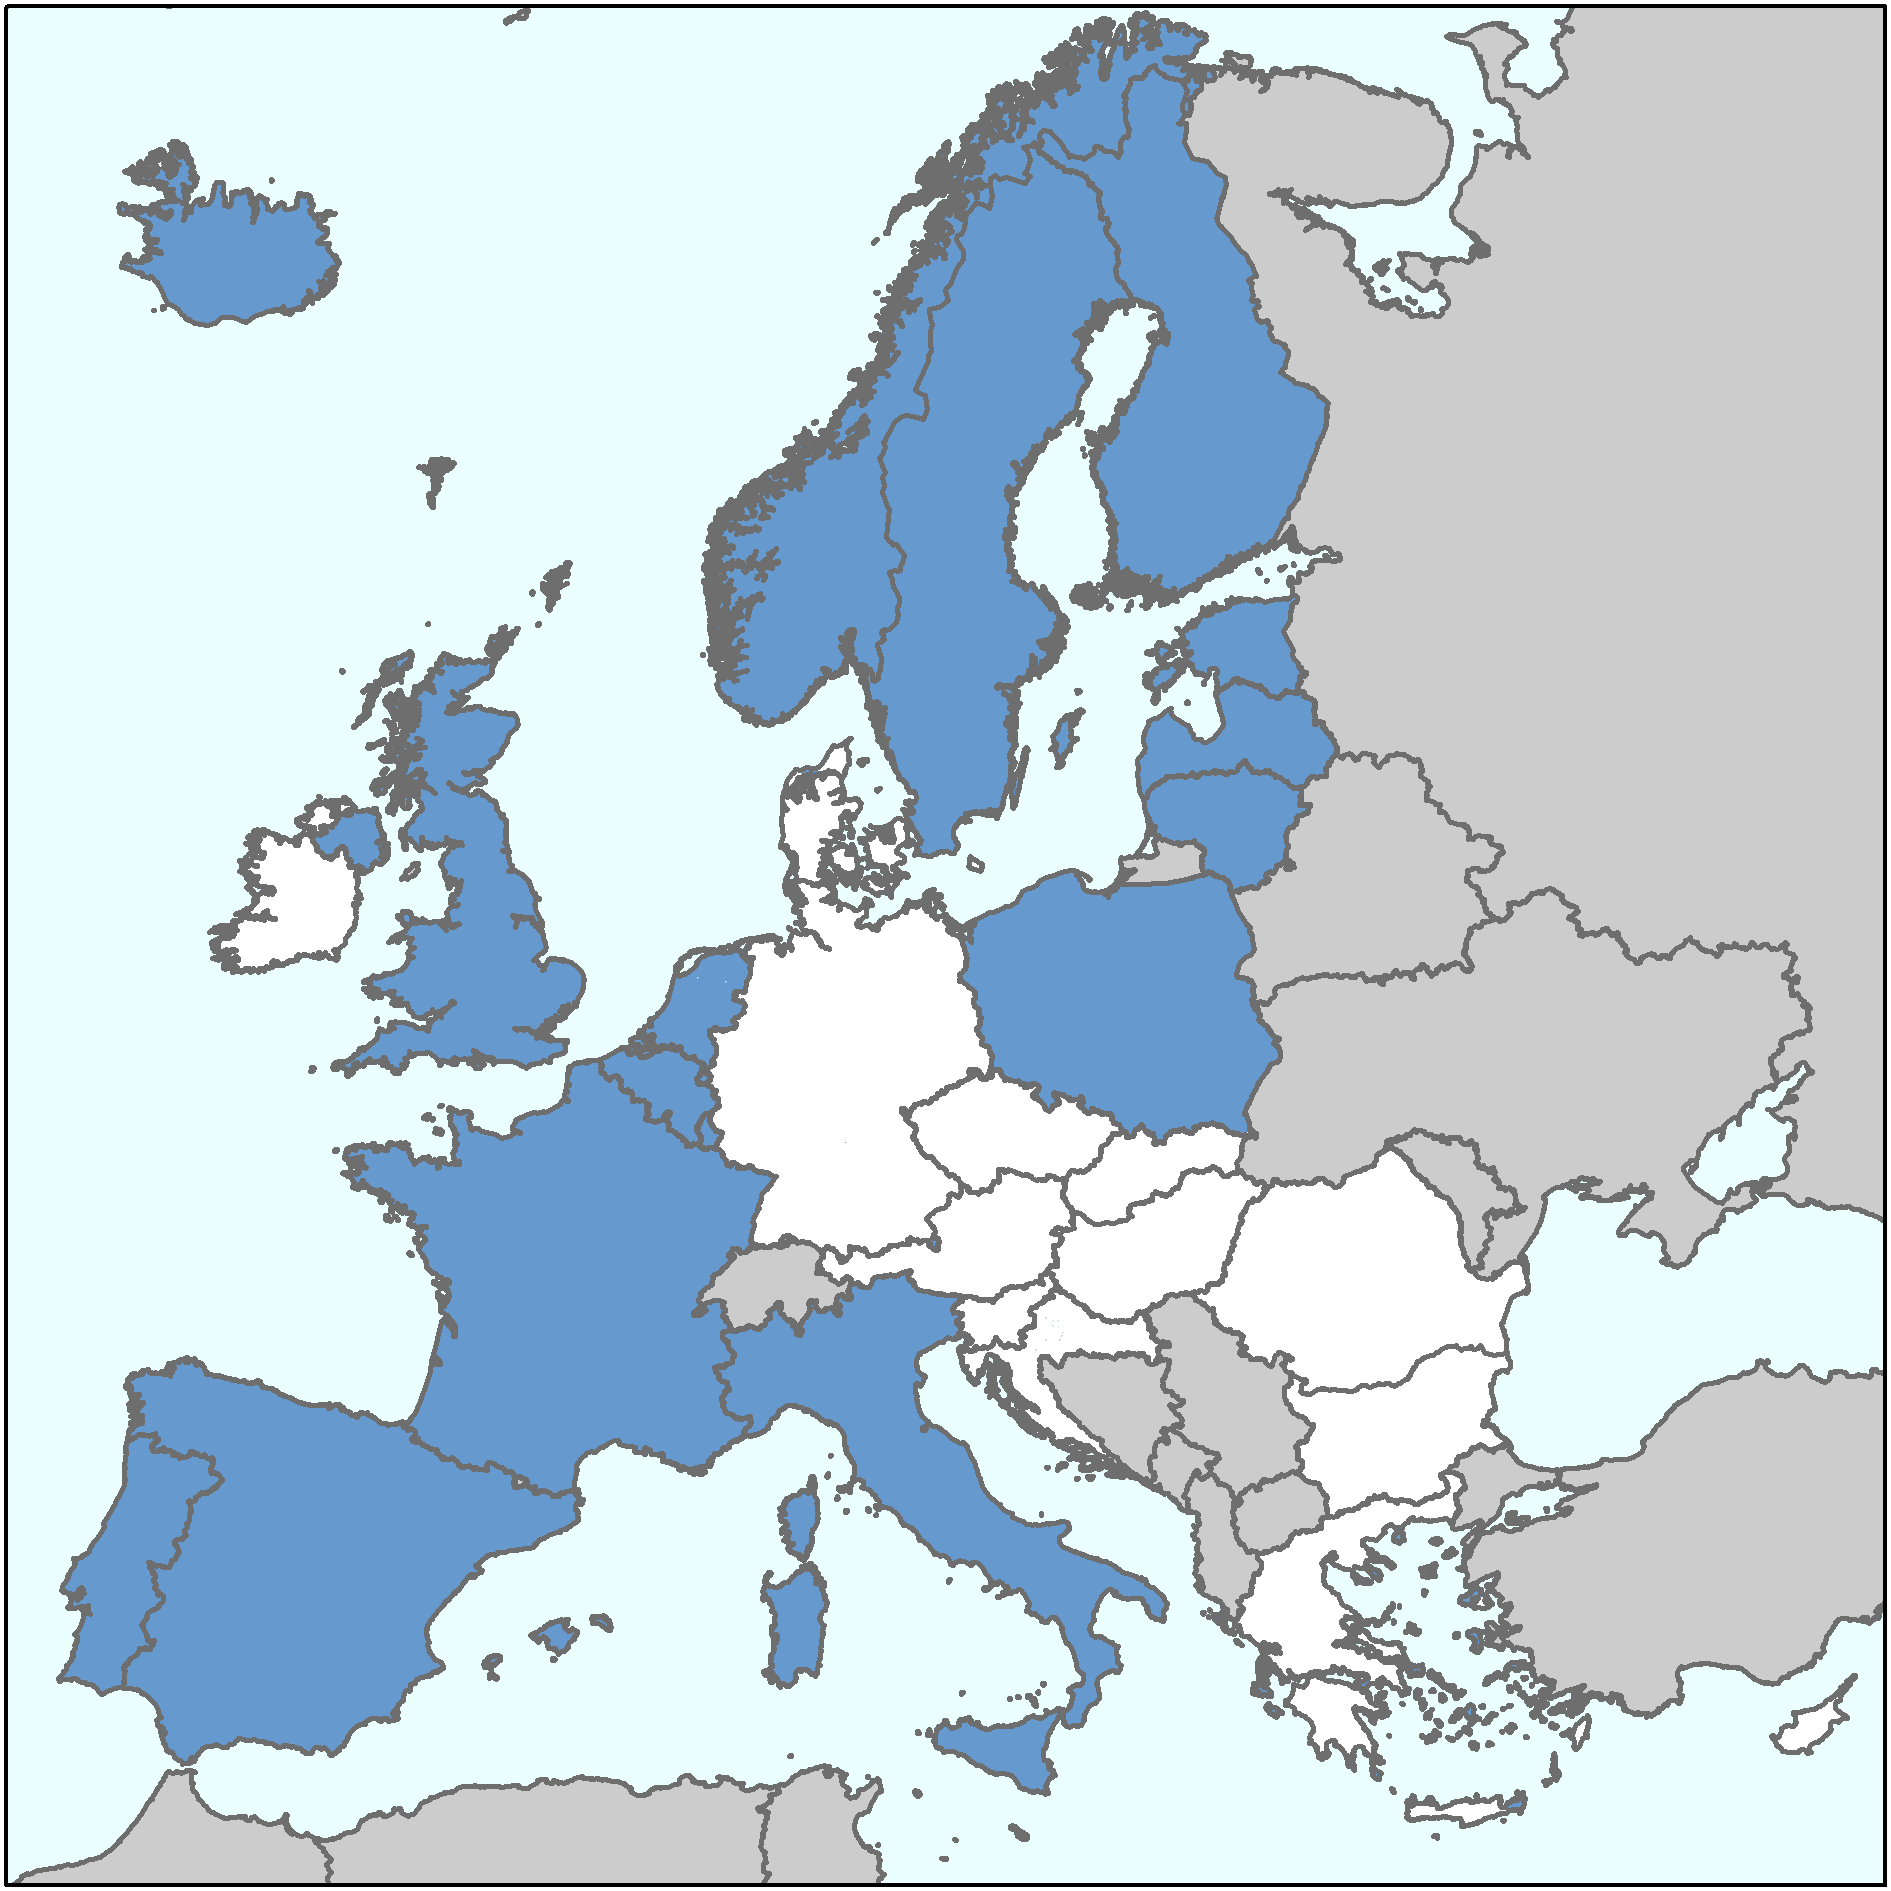
Weekly data coverage |
Monthly data coverage |
 |
 |
| The designations employed and the presentation of material on this map do not imply the expression of any opinion whatsoever on the part of the European Union concerning the legal status of any country, territory, city or area or of its authorities, or concerning the delimitation of its frontiers or boundaries. |
Data are provided by national sources or collected through their related website. Below the list of sources is reported. For more details on the data collected, please download the metadata on data collection.
| Belgium | Vlaams Ministerie van Landbouw en Visserij |
| Bulgaria | Executive Agency for Fisheries and Aquaculture |
| Croatia | Ministry of Agriculture, Forestry and Fisheries |
| Cyprus | Department of Fisheries and Marine Research |
| Denmark | Ministeriet for Fødevarer |
| Estonia | Estonian Ministry of Rural Affairs |
| Faroe Islands | Hagstova Føroya (Statistics Faroe Islands) |
| Finland | Ministry of Agriculture and Forestry of Finland |
| France | FranceAgriMer |
| Germany | Federal Office for Agriculture and Food |
| Greece | Ministry of Rural Development & Food of Greece. |
| Iceland | Hagstofa Íslands (Statistics Iceland) |
| Ireland | Sea-Fisheries Protection Authority(SFPA) |
| Italy | Ministero dell’agricoltura, della sovranità alimentare e delle foreste (MASAF) and Istituto di Servizi per il Mercato Agricolo Alimentare (ISMEA -till week 52 of 2017) |
| Latvia | Centrala statistikas parvalde |
| Lithuania | Valstybes imone Žemes ukio informacijos ir kaimo verslo centras |
| Netherlands | Pan European Fishing Auctions (PEFA - till week 13 of 2018) and Netherlands Enterprise Agency |
| Poland | Ministry of Maritime Economy and Inland Navigation |
| Portugal | Direcção Geral de Recursos Naturais, Segurança e Serviços Marítimos (DGRM) |
| Spain | Ministerio de Agricultura, Alimentación y Medio Ambiente (MAPAMA) |
| Sweden | Swedish Board of Agriculture |
| Iceland | Reiknistofa fiskmarkaða hf (RSF) |
| Norway | Sunmøre og Romsdal Fiskesalslag (SUROFI), Nos Clearing, Norges Sildesalgslag (Sildelaget) and Fiskeridirektorate |
| United Kingdom | Port of Grimsby (till week 43 of 2021), Port of Shetland (till week 20 of 2021), Marine Management Organisation (MMO) |
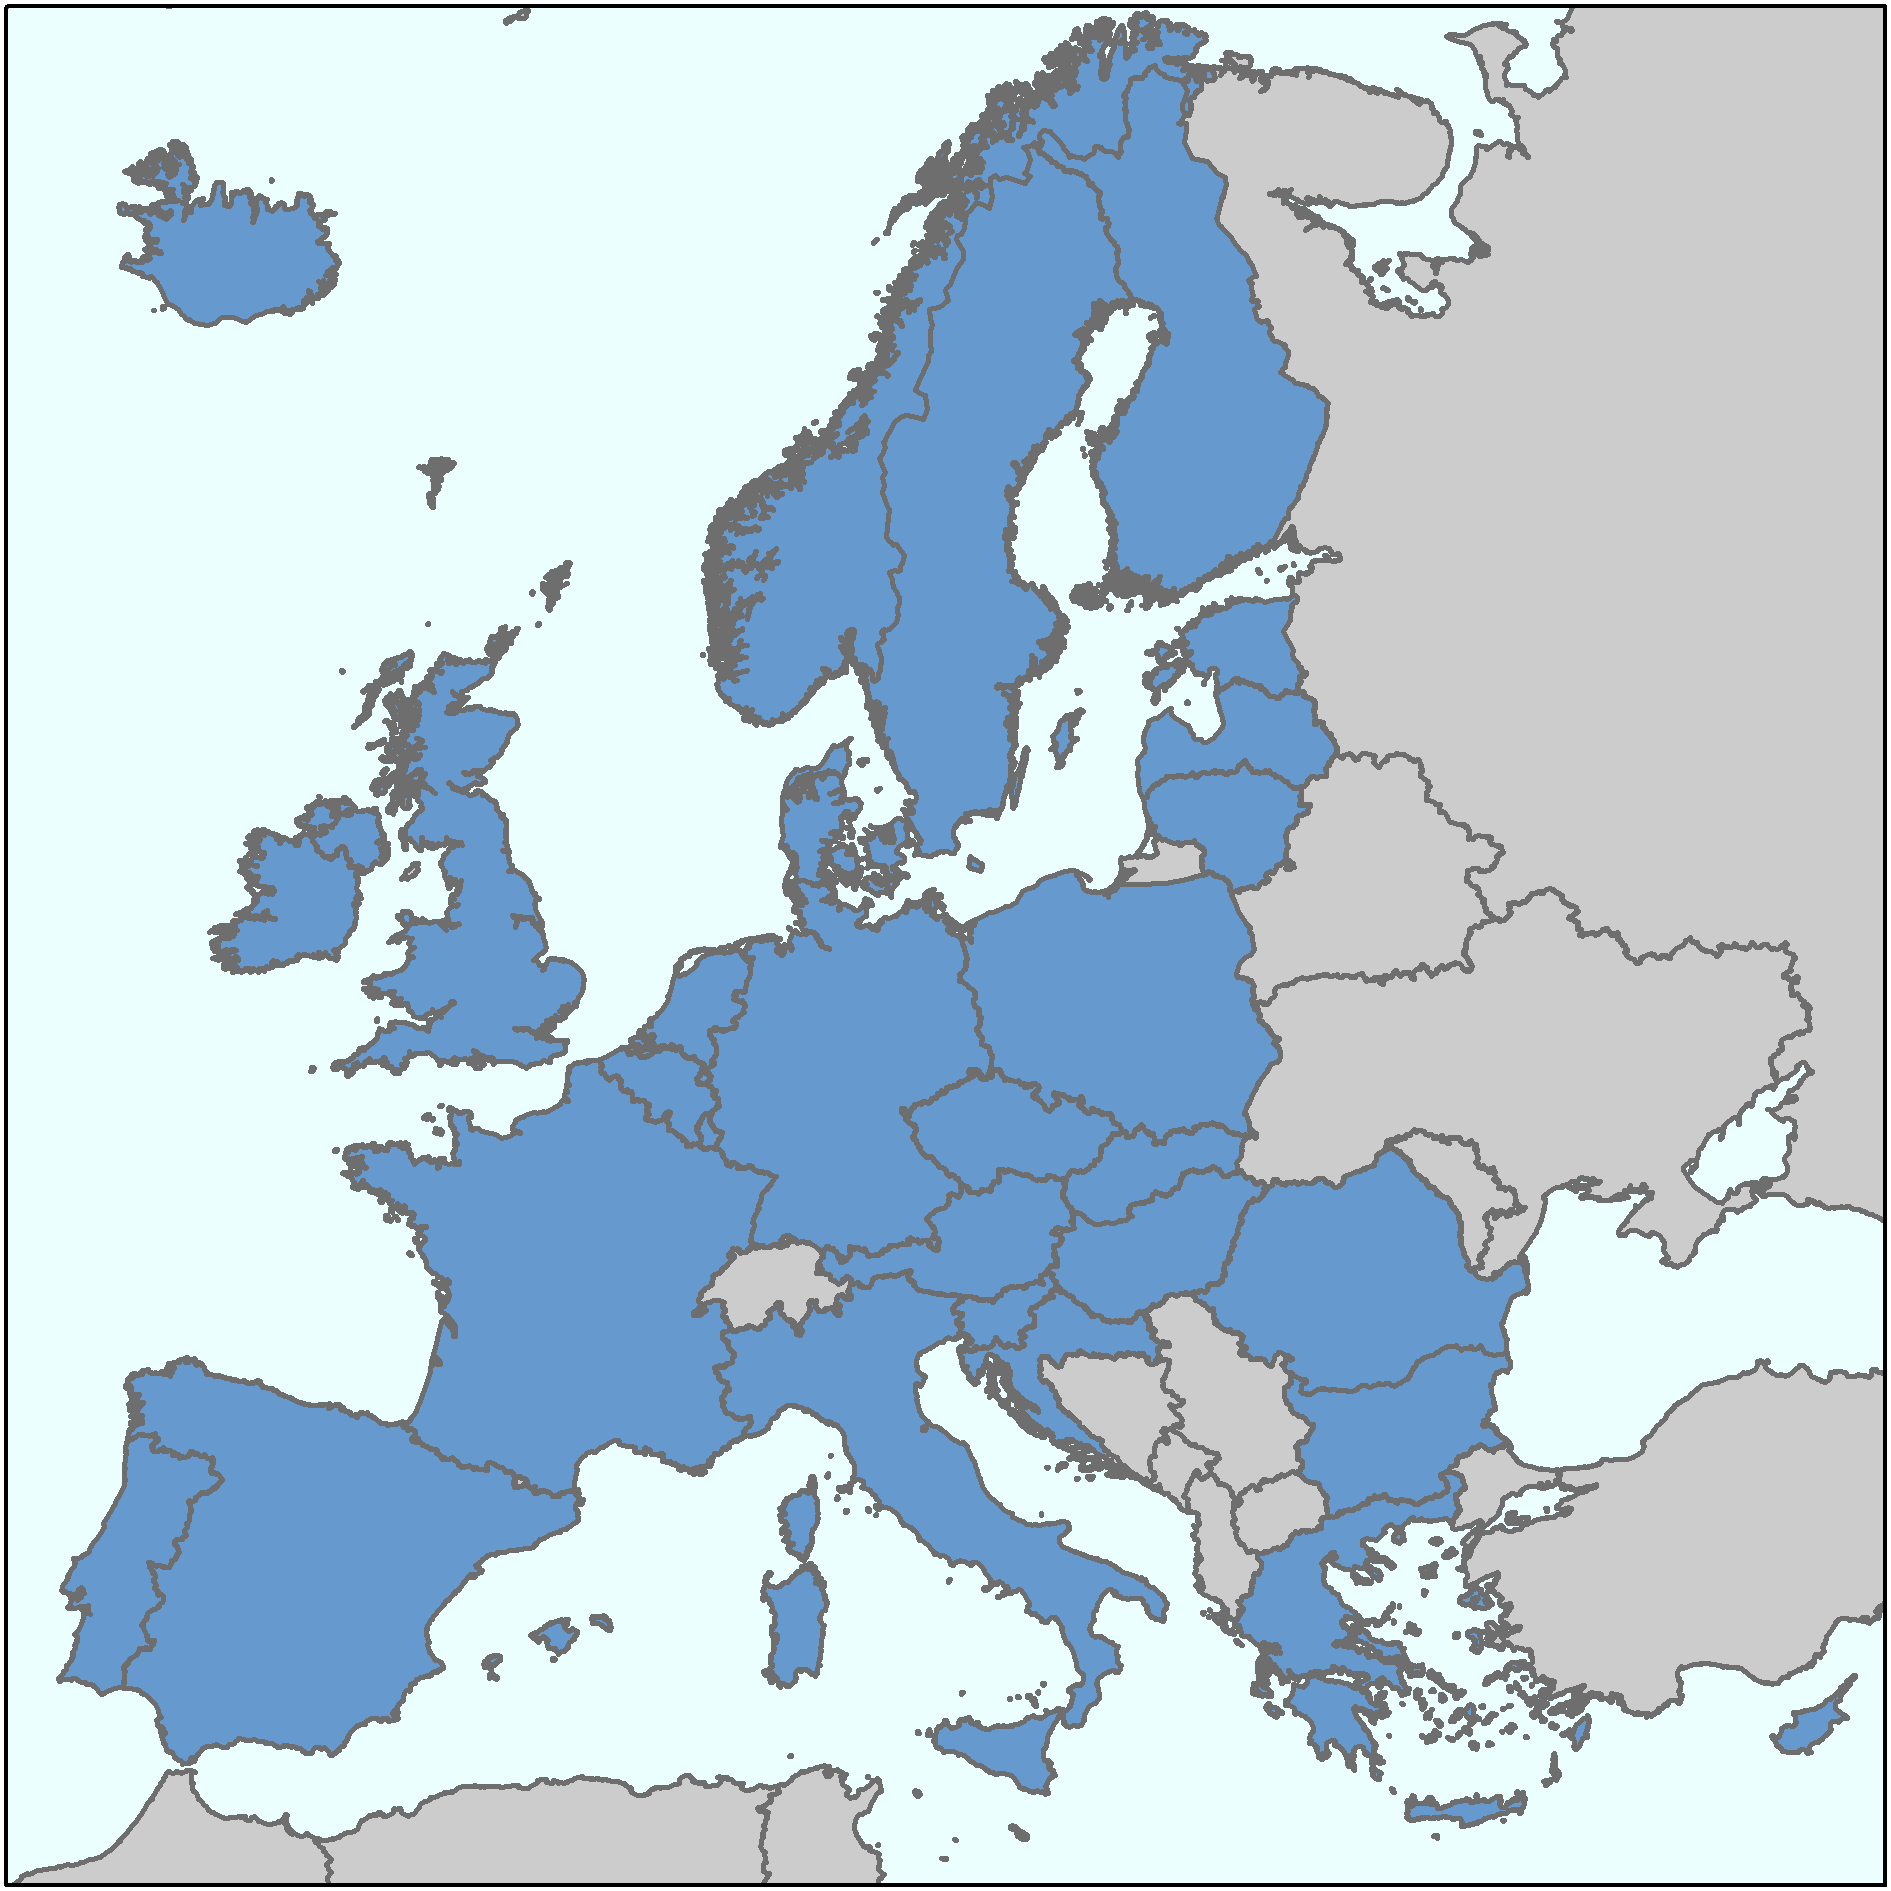
 LANDINGS
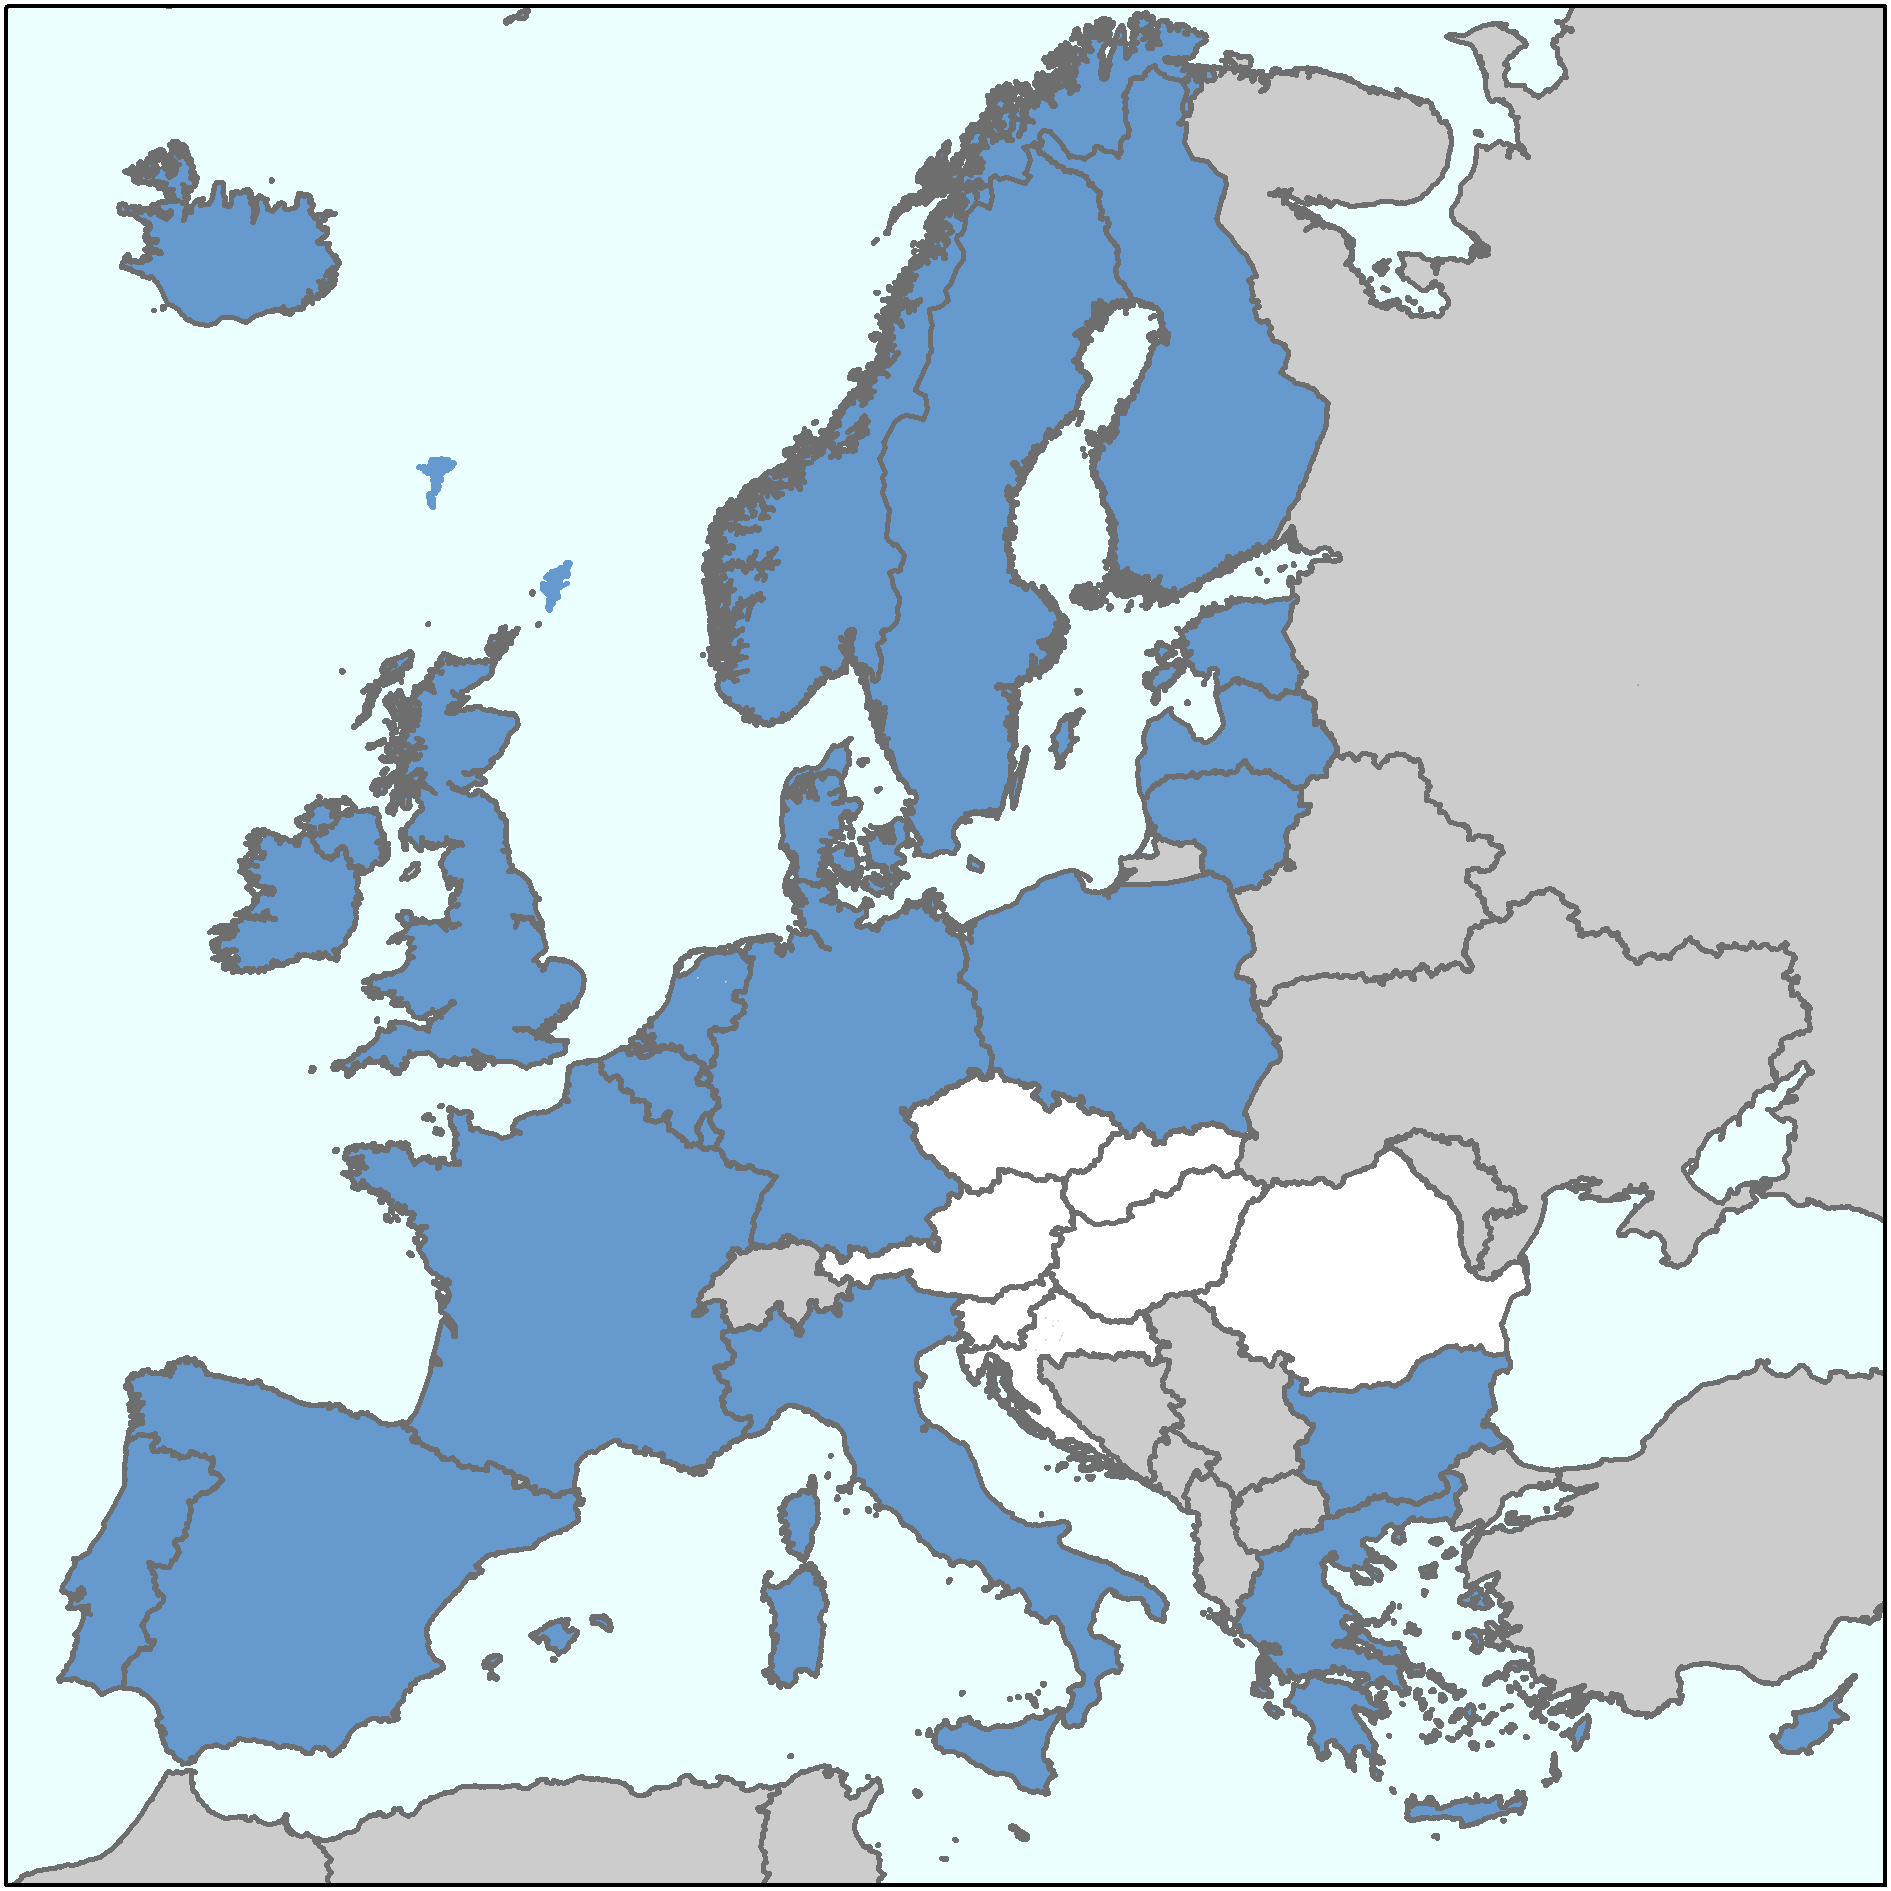
Yearly data coverage |
 |
| The designations employed and the presentation of material on this map do not imply the expression of any opinion whatsoever on the part of the European Union concerning the legal status of any country, territory, city or area or of its authorities, or concerning the delimitation of its frontiers or boundaries. |
The main source used is EUROSTAT, for all EU countries.
For more details on the data collected, please download the metadata on data collection.
The United Kingdom is considered part of the EU till 2019 and its data until that year are available in all tables at EU level. Starting from 2020, the United Kingdom’s yearly data are no longer available in EUMOFA.
The following issues should be highlighted:
- Confidentiality. As indicated by national data providers to Eurostat, landings are confidential when they originate from less than 3 vessels. Therefore, in some instances, Member States provide data at more aggregated level, in others data are just not available. The EUMOFA system discards the records having volume or value equal to zero, because such records would represent partial information invalidating any analysis of data. Details for these instances, broken down by country, year and species involved, are listed below:
- Denmark
For 2017, details on the destination use and/or presentations/preservations of some specific species belonging to the following main commercial species are confidential: eel, pike, cod, sole, sardine, bluefin tuna, crab, cold-water shrimps, Norway lobster, oyster, clam and the groupings “other freshwater fish”, “other groundfish”, “miscellaneous small pelagics” and “miscellaneous tunas”. Only totals are available, and were collected from Statistics Denmark.
- 2019:- for blue whiting, landings of the Irish fleet
- for herring, landings of the German and UK fleets destined for industrial use
- for Atlantic horse mackerel, landings of the Danish fleet destined for industrial use
- for sandeels, landings of the German fleet
- for sprat (= Brisling), landings of the German and Estonian fleets as well as landings of the Latvian fleet destined for industrial use.
- for herring and sprat, landings of the German fleet destined for industrial use and animal feed, respectively.
- for sprat, landings of the Lithuanian and Polish fleets destined for animal feed and industrial use, respectively.
- for blue whiting, landings of the UK fleet.
- for clam, landings of the species Spisula solida of the Danish fleet.
- for blue whiting, landings of the Irish and Icelandic fleets
- for herring, landings of the Dutch fleet.
- for clam, landings of the species Spisula solida of the Danish fleet
- for sandeels, landings of the German fleet
- for boarfishes (included in the main commercial species “Other marine fish”), landings of the UK fleet.
- for boarfishes (included in the main commercial species “Other marine fish”), landings of the Danish and UK fleet
- landings of capelin (included in the main commercial species “Miscellaneous small pelagics”)
- landings of herring destined for human consumption of the Icelandic and UK fleets, as well as landings of herring for unknown destination use of the Danish fleet
- landings of sprat destined for industrial use of the German, Finnish and Polish fleets
- landings of the species Spisula solida
- landings of blue whiting destined for industrial use of the Irish and Icelandic fleets
- Ireland
- 2018
data are confidential for the following main commercial species: abalone, dab, dogfish, European flounder, grenadier, Atlantic halibut, ray’s bream, redfish, sardine, scabbardfish, sea cucumber, European seabass, seabreams, swordfish, bluefin tuna and weever. Furthermore, for all other main commercial species, some confidential figures are excluded, related to vessels’ flag, destination use and/or presentations/preservations of some specific species.
- 2019
data are confidential for the following main commercial species: anchovy, European flounder, grenadier, Greenland halibut, mussel Mytilus spp., sardine, sea urchin, warmwater shrimps, swordfish. Furthermore, for all other main commercial species, some confidential figures are excluded, related to vessels’ flag, destination use and/or presentations/preservations of some specific species.
- 2020
data are confidential for the following main commercial species: eel, European flounder, grenadier, haddock, Atlantic halibut, herring, horse mackerel, redfish, sea cucumber, bigeye tuna, weever. Furthermore, for all other main commercial species, some confidential figures are excluded, related to vessels’ flag, destination use and/or presentations/preservations of some specific species.
- 2021
data are confidential for the following main commercial species: Greenland halibut, mussel Mytilus spp. (blue mussel), salmon, sardine, swordfish, and bluefin tuna. Furthermore, for all other main commercial species, several confidential figures are excluded, related to vessels’ flag, destination use and/or presentations/preservations of some specific species.
- 2022
data are confidential for the following main commercial species: anchovy, redfish and trout. Furthermore, for all other main commercial species, several confidential figures are excluded, related to vessels’ flag, destination use and/or presentations/preservations of some specific species.
- In addition, the following data were collected from SFPA (Sea-Fisheries Protection Authority) and Central Statistics Office:- 2013, 2014, 2018 and 2019 data regarding hake
- 2014 data regarding mackerel
- 2016 data regarding herring
- 2018 data regarding blue whiting and monk
- 2019 data regarding the value of mackerel and blue whiting
- Greece
2016 and 2017 data are confidential for those landings made by one single vessel operating in Atlantic, Eastern Central regarding the following main commercial species: cuttlefish, flounder (other than European flounder), John dory and the grouping “other flatfish”. Only for 2017, data do not include confidential figures for frozen deep-water rose shrimp.
Furthermore, for 2016-2017-2018, some confidential figures are excluded related to destination use and/or presentations/preservations of some specific species. These concern:- For 2016-2017: some species belonging to the following main commercial species: octopus, red mullet, seabream (other than gilt-head seabream), squid, and the groupings “other sharks” and “other marine fish”. Only for 2017, data do not include confidential figures for some species belonging to the grouping “warmwater shrimps”.
- For 2018: some species belonging to the following main commercial species: crab, John dory, octopus, red mullet, squid, seabream (other than gilthead seabream) and the grouping “other marine fish”.
- Malta
Data regarding landings made by vessels with Cyprus flag are excluded as they are confidential.
- Denmark
- Provisional data
- France
2018, 2019, 2020 and 2021 volumes and values are provisional data available in Eurostat. - Italy
2018, 2019 and 2020 volumes and values are provisional data available in Eurostat.
- France
- Estimates
- Bulgaria
2017 and 2020 volumes and values are national estimates available in Eurostat. - Denmark
Values for 2019, 2020, 2021 and 2022 include national estimates available in Eurostat. - Ireland
Volumes and values for 2017, and values for 2020 and 2022, include national estimates available in Eurostat. - Lithuania
Volumes and values for 2017 are national estimates available in Eurostat. - Netherlands
Volumes and values for 2017, 2018, 2019, 2020, 2021 and 2022 include national estimates available in Eurostat. - Portugal
Volumes and values for 2018, 2019, 2020, 2021 and 2022 include national estimates available in Eurostat. - Romania
Volumes and values for 2017 are national estimates available in Eurostat. - United Kingdom
Volumes and values for 2009, 2010, 2011, 2012 and 2019 include national estimates available in Eurostat
- Bulgaria
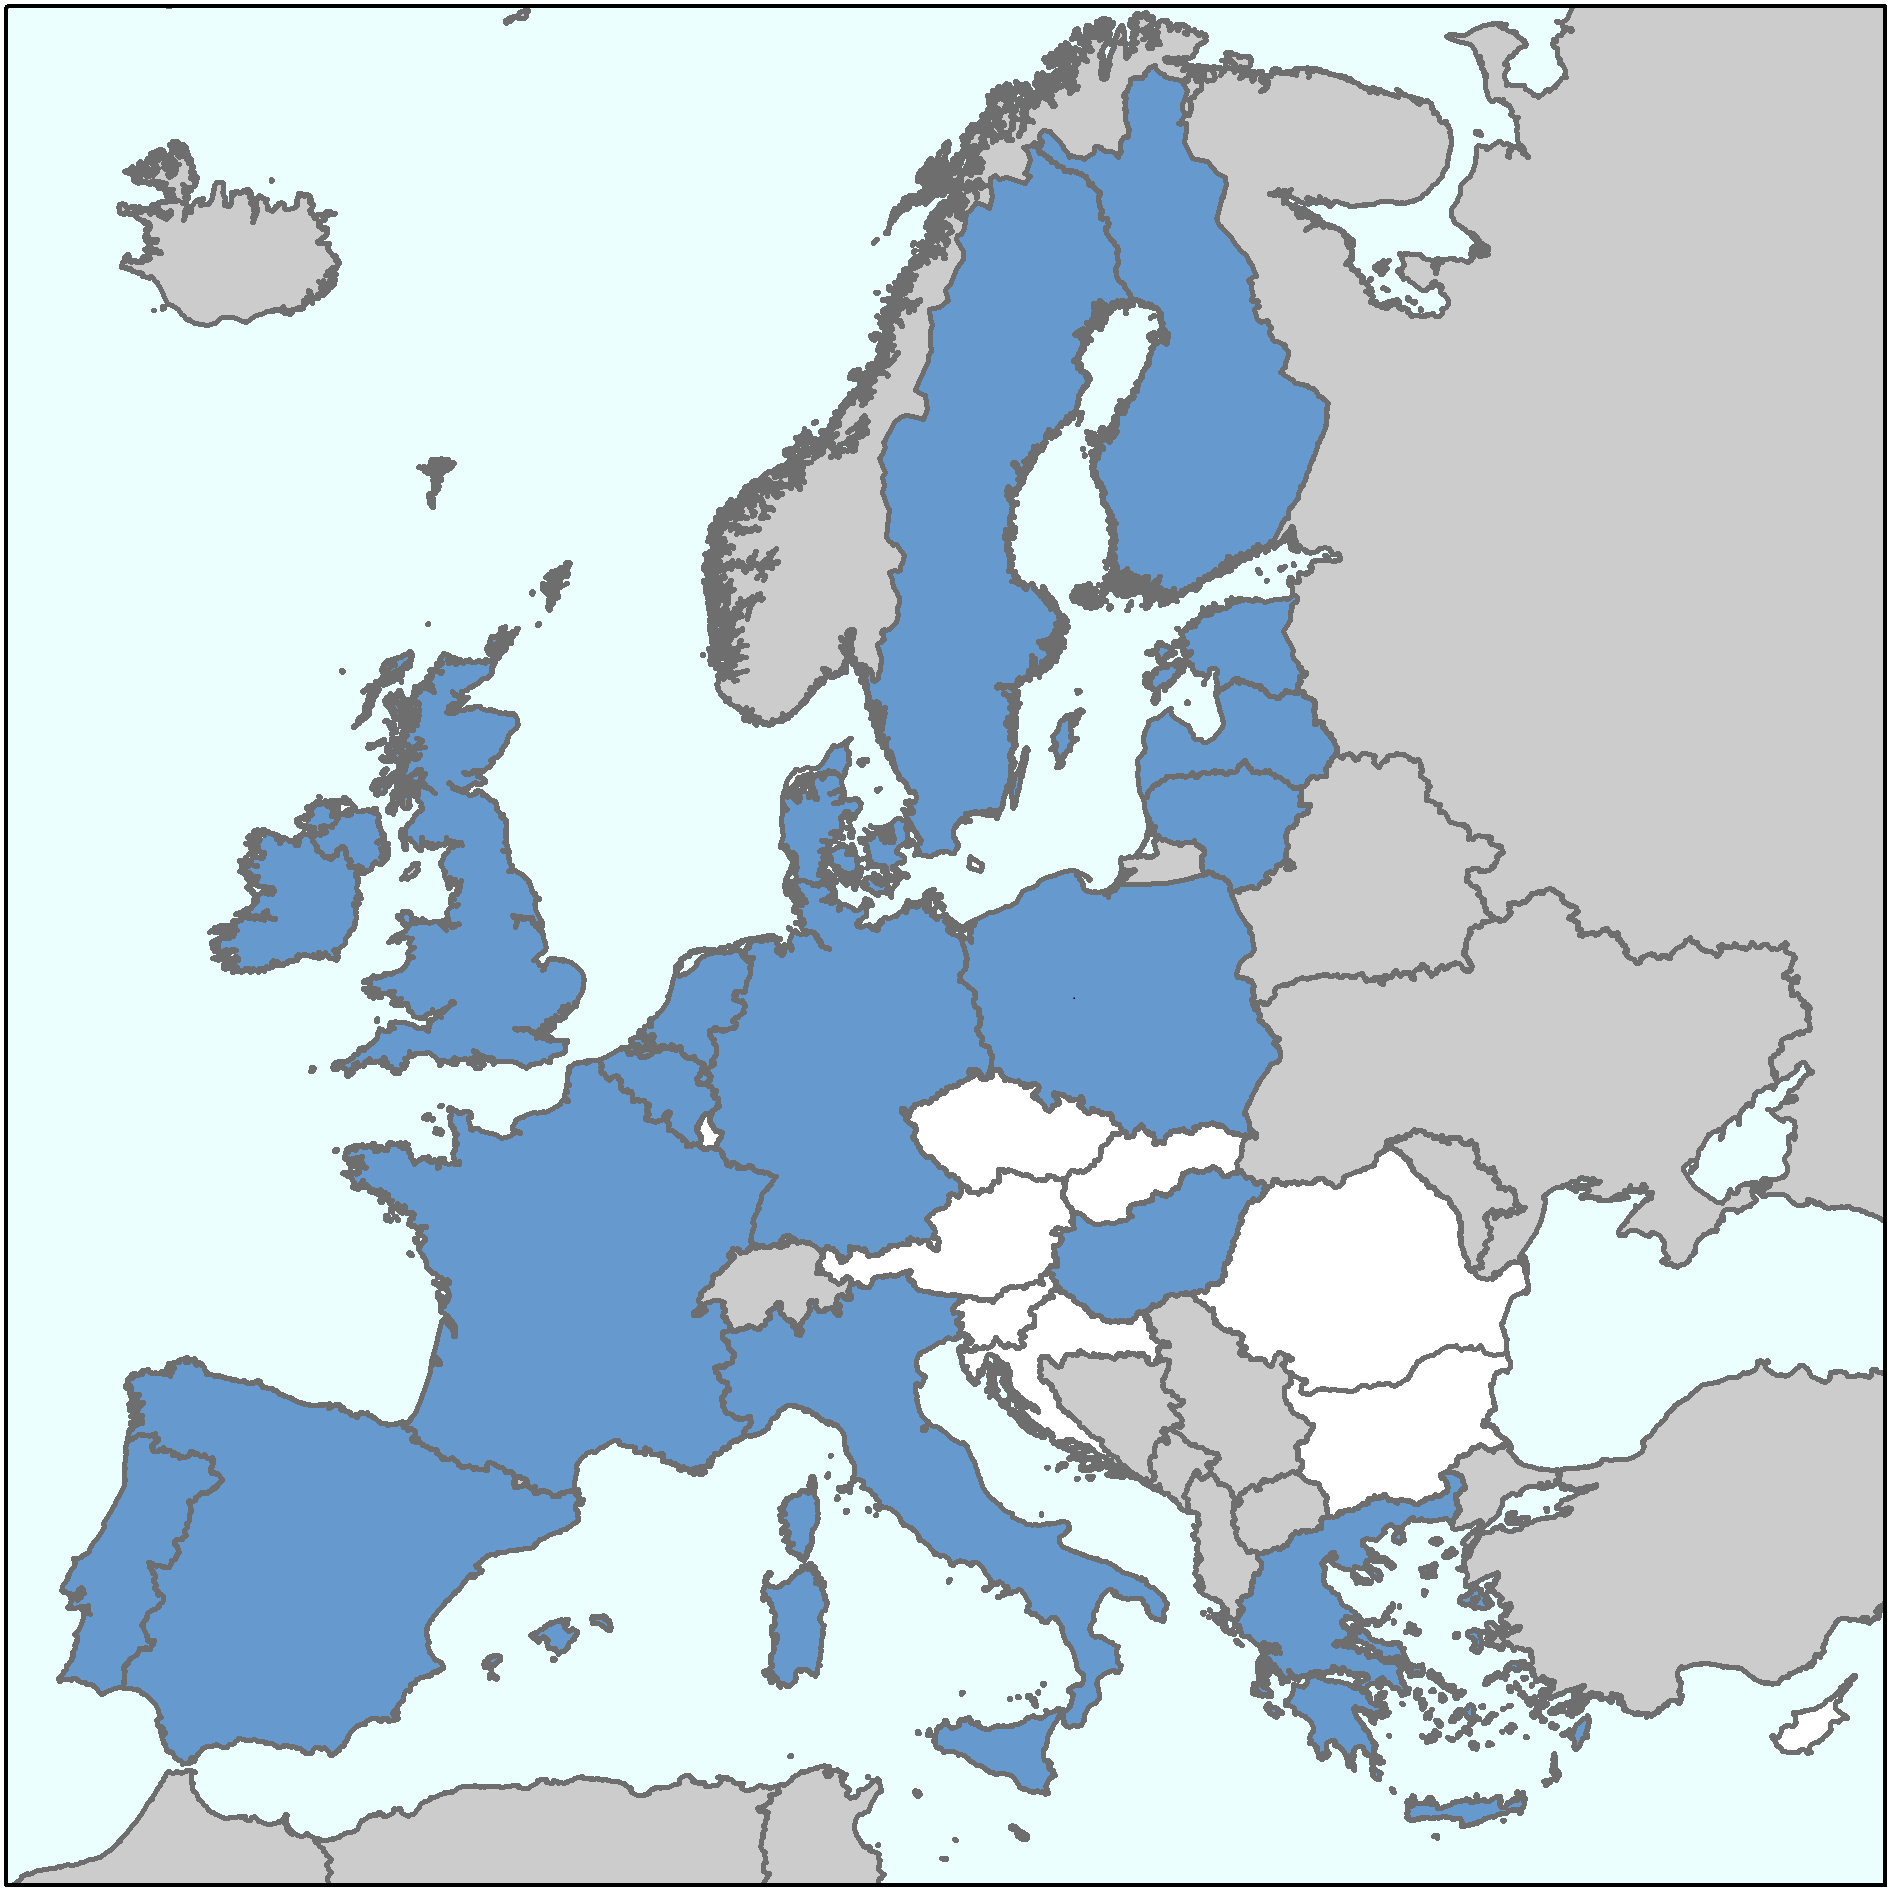
 AQUACULTURE
Yearly data coverage |
|
| The designations employed and the presentation of material on this map do not imply the expression of any opinion whatsoever on the part of the European Union concerning the legal status of any country, territory, city or area or of its authorities, or concerning the delimitation of its frontiers or boundaries. |
The main source used is EUROSTAT, for all EU countries. For more details on the data collected, please download the metadata on data collection.
The United Kingdom is considered part of the EU till 2019 and its data until that year are available in all tables at EU level. Starting from 2020, the United Kingdom’s yearly data are no longer available in EUMOFA.
The following issues should be highlighted:
- Belgium
2016 Eurostat confidential data were integrated with FAO estimates.
2017-2021 data were collected from FAO.
- Bulgaria
2011 data on catfish and the grouping “other freshwater fish” were collected from FAO.
2013 and 2014 data on mussel Mytilus spp. and pike were collected from FAO.
2014 data on freshwater crayfish were collected from FAO.
2016-2017 values for seaweed and eel were collected from FAO.
2018 data for seaweed were collected from FAO.
2019-2020 data for oyster were collected from FAO.
2020 data on the grouping “other freshwater fish” were integrated with figures from FAO.
- Czechia
2011 data on freshwater catfish and the grouping “other freshwater fish” were collected from FAO.
2020 data on freshwater catfish were integrated with figures from FAO.
- Denmark
Data on salmon were collected from FAO.
2013 data on turbot, char, sturgeon, and pike-perch were collected from FAO.
2015-2018 data for seaweed were collected from FAO, those of 2015 and 2016 being forecasts.
2014, 2015 and 2016 Eurostat confidential data were integrated with figures from FAO (those on eel for 2016 being forecasts).
2011, 2017 and 2018 data for pike-perch were collected from FAO.
2017-2018 data for the groupings “other salmonids” and “other freshwater fish” were collected from FAO.
2018 data on eel are FAO forecasts.
2019 and 2021 data on values were integrated with figures from FAO, those on 2021 being estimates.
2020 data on most of the species were integrated with figures from FAO.
- Germany
Data on carp for the years 2011-2012 and 2014, 2015, 2016 and 2018 were collected from FAO.
2011-2021 Eurostat confidential data for some species were integrated with figures from FAO, those of oyster and those on the value of tilapia being estimates.
2011 Eurostat confidential data on the grouping “other freshwater fish” were integrated with figures from FAO.
2011 Eurostat confidential data for trout, pike, pike-perch and eel were integrated with figures collected from the national source (DESTATIS).
- Estonia
2012, 2014 and 2015 Eurostat confidential data were integrated with figures from FAO.
2016-2019 Eurostat confidential data on the grouping “other freshwater fish” were integrated with figures from FAO.
2019 Eurostat confidential data on trout were integrated with figures from FAO.
2021 Eurostat confidential data on sturgeon were integrated with figures from FAO.
2020-2021 data for the grouping “other freshwater fish” were collected from FAO.
- Ireland
For 2014, values are National estimates available in Eurostat except from scallop and the grouping “Other molluscs and aquatic invertebrates”, whose confidential values were integrated with figures from FAO.
For 2015, Eurostat confidential values of the grouping “Other molluscs and aquatic invertebrates” were integrated with figures from FAO.
2016 data on the grouping “other molluscs and aquatic invertebrates” were collected from FAO.
2017-2018 data are National estimates available in Eurostat.
2020 data for molluscs were integrated with figures from FAO.
- Greece
2013 Eurostat confidential data were integrated with figures from FAO.
2015 and 2016 Eurostat confidential data on the grouping “other freshwater fish” were integrated with figures from FAO.
2017 data are National provisional figures available in Eurostat.
- Spain
2019-2020 data on most of the species were integrated with figures from FAO.
- France
For sole, data are FAO forecasts.
For salmon, 2015-2017 data are FAO forecasts. 2010-2014 data were integrated with figures provided by FEAP and respective values were estimated by multiplying the volumes to its 2008-unit price, as available in Eurostat.
For turbot, 2015-2017 data are FAO forecasts. 2009-2014 data were integrated with figures provided by FEAP and respective values were estimated by multiplying the volumes to its 2008-unit price, as available in Eurostat.
2012-2013 and 2016-2017 data on carp, catfish and other freshwater fish include National estimates available in Eurostat.
2018-2019 data on values of carp, pike, pike-perch and on the grouping “other freshwater fish” include National estimates available in Eurostat.
2019-2020 data for abalone are FAO’s forecasts.
- Croatia
2020 data the grouping “other freshwater fish” were integrated with figures from FAO.
2021 data were collected from FAO.
- Hungary
2016 data for the grouping “other freshwater fish” were collected from FAO.
2020 data for freshwater catfish were integrated with figures from FAO.
- Italy
2015 data are National estimates and forecasts available in Eurostat.
2017 data on grooved carpet shell are FAO forecasts.
2020 data for warmwater shrimps were collected from FAO.
- Latvia
2014-2015 and 2017-2018 Eurostat confidential data were integrated with figures from FAO.
2019 data for pike and pike-perch were collected from FAO.
- Lithuania
2019-2020 data for pike-perch were collected from FAO.
- Netherlands
For eel, freshwater catfish and the grouping “other marine fish”, 2012, 2015, 2018 and 2019 values are National estimates available in Eurostat.
For mussel, data of 2012 and 2014-2016 are National estimates available in Eurostat.
For turbot, 2012 data are National estimates available in Eurostat, and data of 2008-2010 and 2013-2017 are FAO forecasts.
For pike-perch, all data are FAO forecasts.
2019-2020 data on most of the species were integrated with figures from FAO.
- Austria
2011-2019 Eurostat confidential data were integrated with figures from FAO.
- Poland
2011 data for freshwater crayfish, pike, trout, salmon and other freshwater fish are National provisional figures available in Eurostat.
2016 data on tilapia are FAO forecasts.
2019-2020 data on the grouping “other freshwater fish” were integrated with FAO’s forecasts.
2021 data were collected from FAO, most of them being estimates.
- Portugal
2013 and 2014 data on clam are National estimates available in Eurostat.
For 2015, data on trout and clam are National estimates available in Eurostat while data on all other species are National provisional figures available in Eurostat.
2015-2018 data on sea mussels were collected from FAO.
2020 data on the grouping “other marine fish” were integrated with figures from FAO.
- Romania
2015 data are National estimates available in Eurostat.
For turbot, 2015-2016 data are FAO forecasts.
2019 data are National estimates available in Eurostat.
2020 data on freshwater catfish and on the grouping “other freshwater fish” were integrated with FAO’s forecasts.
- Slovenia
2012 data on mussel Mytilus spp. were collected from FAO (the latter being forecasts).
2013- 2016 Eurostat confidential data were integrated with figures from FAO.
2016 and 2018 data on European seabass, and 2015, 2017 and 2018 data on clam are FAO forecasts.
2017 and 2019 Eurostat confidential data on the groupings “other freshwater fish” and “other salmonids” were integrated with figures from FAO, and those on European seabass with FAO forecasts.
2020 data on European seabass and on the groupings “other marine fish” and “other freshwater fish” were integrated with FAO’s forecasts.
- Slovakia
For 2019, data on pike and pike-perch are FAO forecasts. In addition, data on the following species were integrated with FAO forecasts: carp, freshwater catfish, trout.
2020 data for most of the species were integrated with FAO’s forecasts.
2021 data for most of the species were integrated with FAO’s estimates, including Eurostat confidential data on catfish.
- Sweden
Salmon data 2013, 2014 and 2016 were collected from FAO.
2019 Eurostat confidential data on mussel, and on the groupings “other freshwater fish” and “other salmonids” were integrated with FAO’s forecasts.
2021 Eurostat confidential data on the value of rainbow trout and arctic char were integrated with FAO’s estimates.
- United Kingdom
2008 values of Atlantic halibut, European seabass, clam, warmwater shrimp, turbot, great Atlantic scallop and the grouping “Other molluscs and aquatic invertebrates” were integrated using FAO; value of queen scallop was estimated by multiplying the volume to its 2009-unit price, as available in Eurostat. 2014-2018 values are National estimates available in Eurostat.
2019 data are FAO forecasts.
 IMPORT-EXPORT
Import - Weekly data coverage |
Import-Export - Monthly data coverage |
 |
 |
| The designations employed and the presentation of material on this map do not imply the expression of any opinion whatsoever on the part of the European Union concerning the legal status of any country, territory, city or area or of its authorities, or concerning the delimitation of its frontiers or boundaries. |
For weekly imports of a selection of relevant products imported in the EU from extra-EU countries, the source is the European Commission.
For monthly trade flows (volumes and values) reported by EU Member States, the source is EUROSTAT.
For trade data between non-EU countries, monthly volumes and values are collected from Trade Data Monitor. Countries covered can be consulted here.
For more details on the data collected, please download the metadata on data collection.
The United Kingdom is considered part of the EU till January 2020 and its data until that month are available in all tables at EU level. Starting from February 2020, the United Kingdom’s monthly data are available separately, together with other non-EU countries (Iceland and Norway).
 PROCESSING
Yearly data coverage |
|
| The designations employed and the presentation of material on this map do not imply the expression of any opinion whatsoever on the part of the European Union concerning the legal status of any country, territory, city or area or of its authorities, or concerning the delimitation of its frontiers or boundaries. |
Processing data are collected from the EUROSTAT PRODCOM database, where data are organised in a specific nomenclature (PRODCOM classification of manufactured goods).
The United Kingdom is considered part of the EU till 2019 and its data until that year are available in all tables at EU level. Starting from 2020, the United Kingdom’s yearly data are no longer available in EUMOFA.
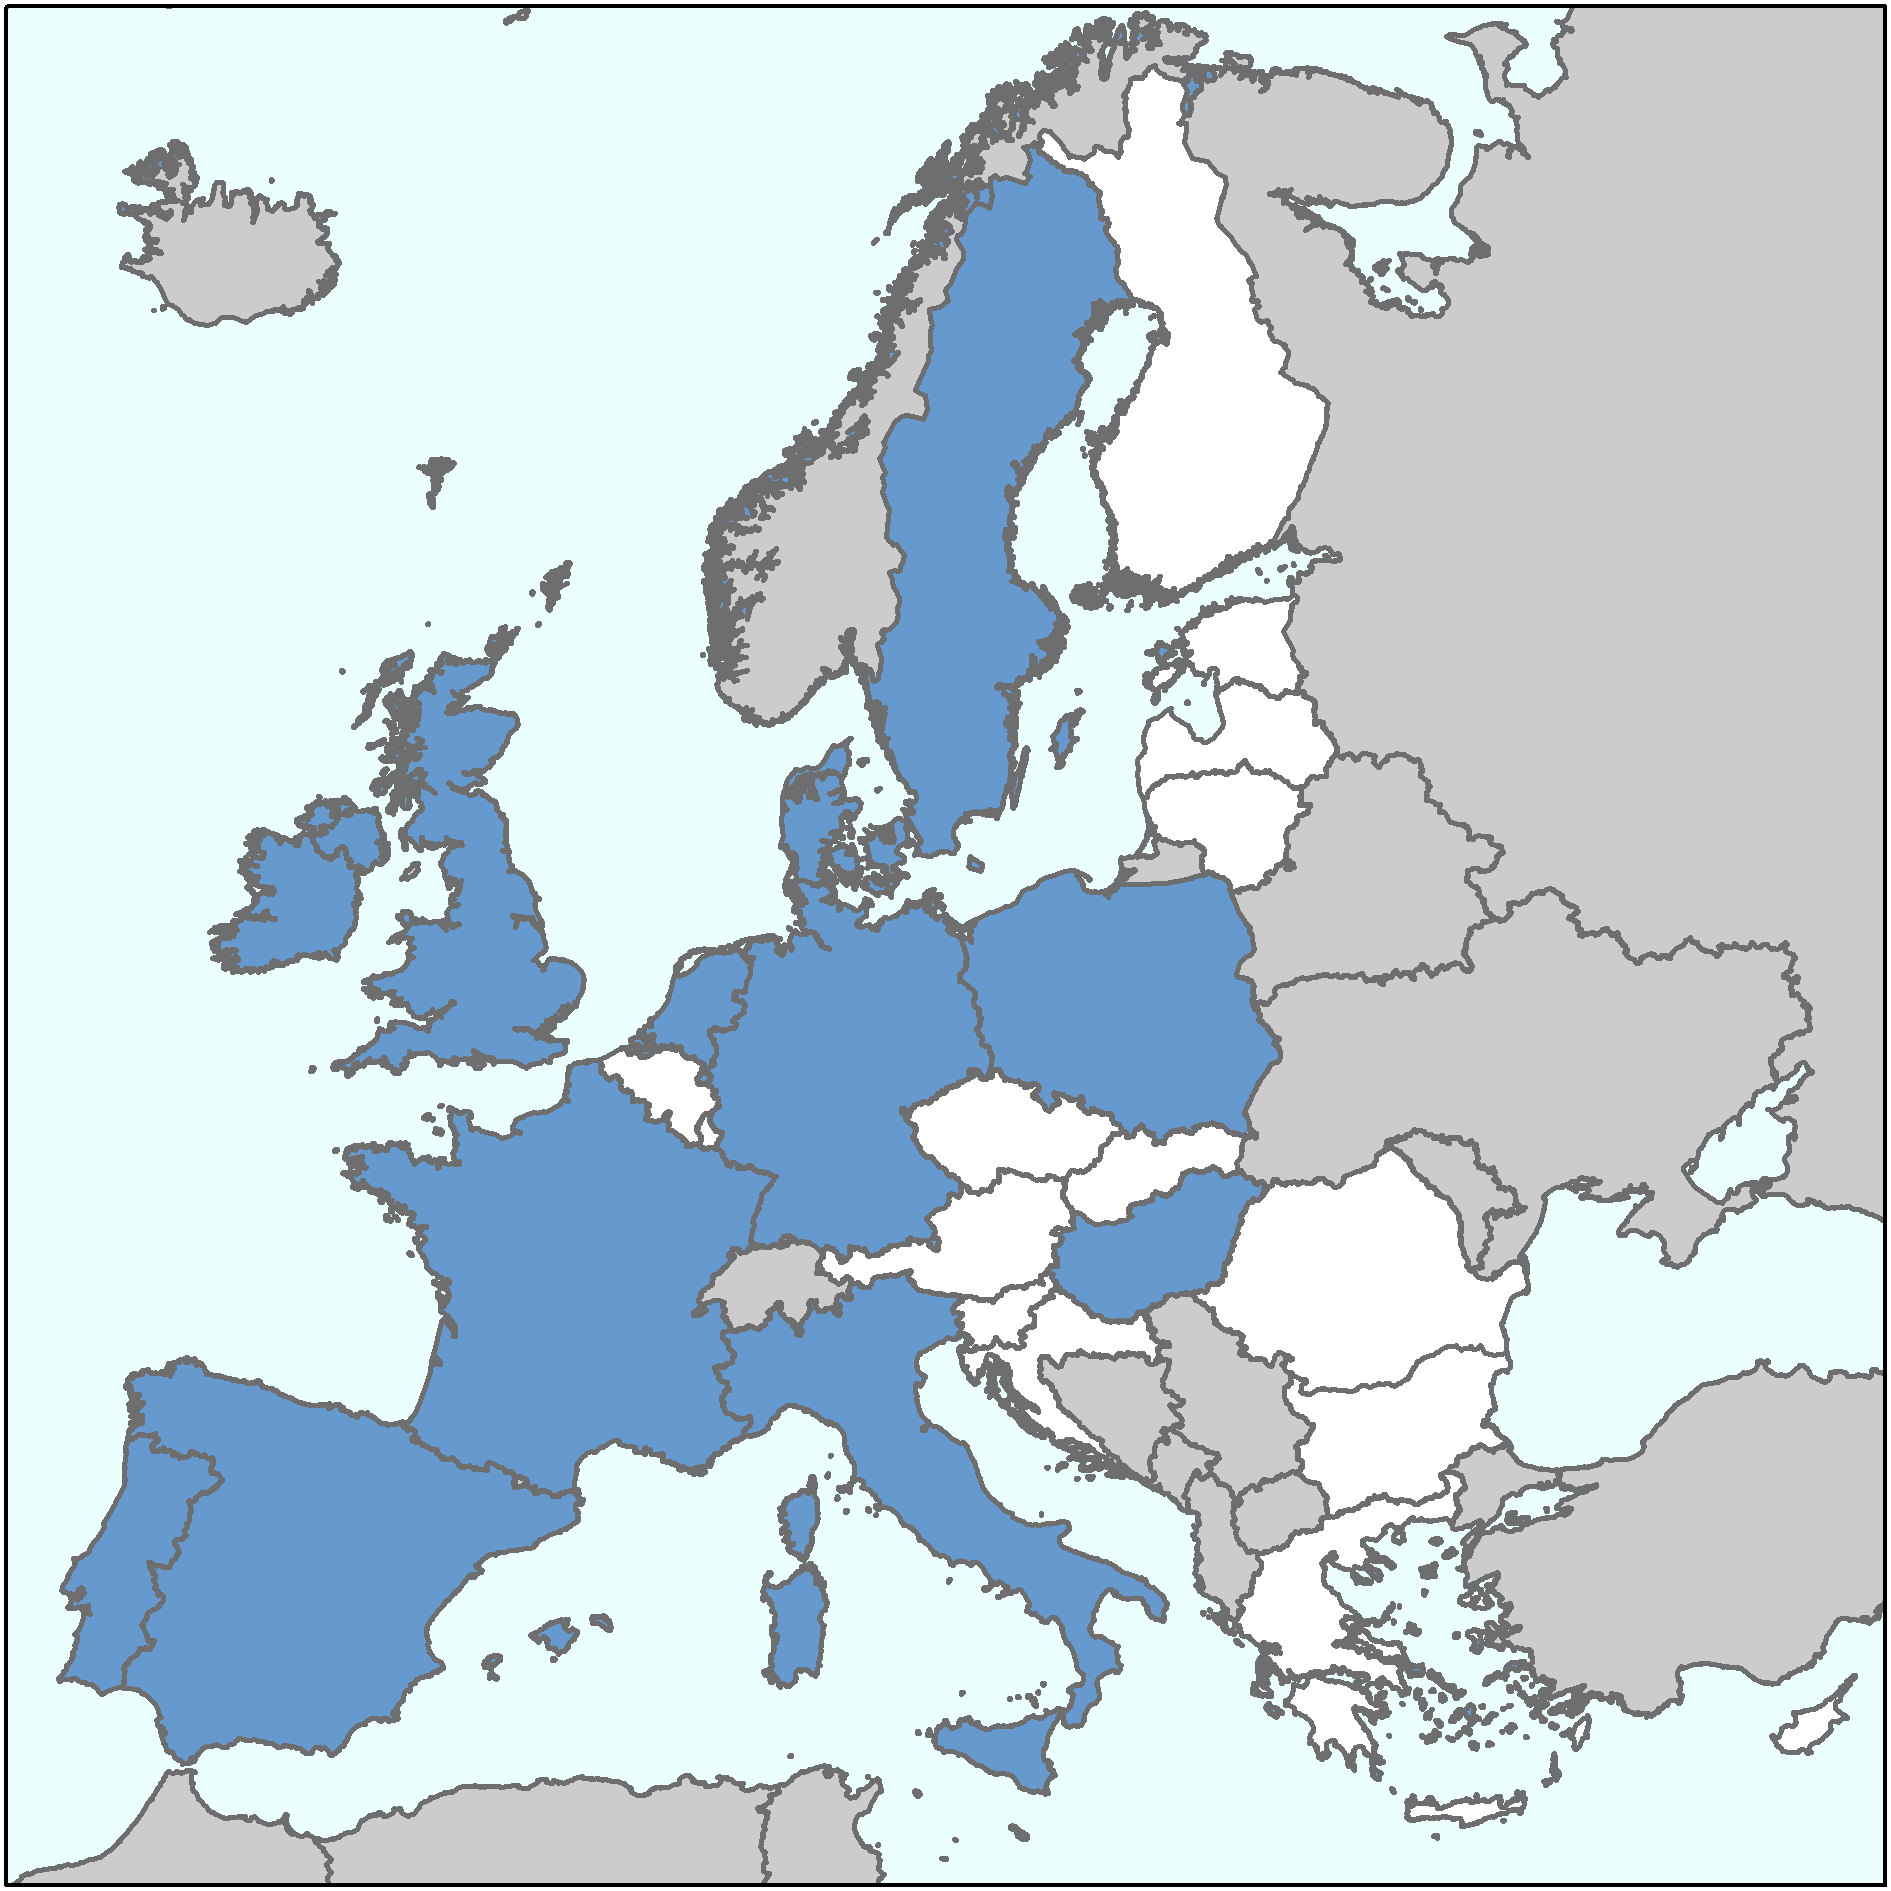
 RETAIL - CONSUMPTION
Weekly retail |
Monthly consumption |
Yearly apparent consumption |
 |
 |
|
| The designations employed and the presentation of material on this map do not imply the expression of any opinion whatsoever on the part of the European Union concerning the legal status of any country, territory, city or area or of its authorities, or concerning the delimitation of its frontiers or boundaries. |
Weekly and monthly data on retail-consumption are provided by national sources or private providers. Below the list of sources is reported. For more details on the data collected, please download the metadata on data collection.
The United Kingdom is considered part of the EU till January 2020 and its data until that month are available in all tables at EU level. Starting from February 2020, the United Kingdom’s monthly data are available separately, together with other non-EU countries (Iceland and Norway).
| Country | Source | Type of data collected | Dissimination in EUMOFA |
| Denmark | Europanel | monthly volumes and values of households’ fresh consumption | Weekly section: monthly unit values are spread over the weeks of a given month |
| Monthly section: monthly volumes and values of households’ fresh consumption | |||
| Estonia | Estonian Ministry of Rural Affairs | Weekly retail prices (data not available for week 1 to week 13 of 2022) | Weekly section: weekly retail prices as collected from Estonian Ministry of Rural Affairs |
| Finland | Tilastokeskus | monthly retail prices (till December 2018) | Weekly section: monthly prices are spread over the weeks of a given month |
| France | FranceAgriMer | weekly retail prices | monthly volumes and values of households’ fresh consumption |
| Weekly section: weekly retail prices as collected from FranceAgriMer | Monthly section: monthly volumes and values of households’ fresh consumption | ||
| Germany | Europanel | monthly volumes and values of households’ fresh consumption | Weekly section: monthly unit values are spread over the weeks of a given month |
| Monthly section: monthly volumes and values of households’ fresh consumption | |||
| Greece | Ministry of development, competitiveness and shipping | monthly retail prices (till June 2020) | Weekly section: monthly prices are spread over the weeks of a given month |
| Hungary | Research Institute of Agriculture Economics | monthly retail prices | Weekly section: monthly prices are spread over the weeks of a given month |
| Europanel | monthly volumes and values of households’ fresh consumption (total only) | Monthly section: monthly volumes and values of households’ fresh consumption (total only) | |
| Ireland | Europanel | monthly volumes and values of households’ fresh consumption | Weekly section: monthly unit values are spread over the weeks of a given month |
| Monthly section: monthly volumes and values of households’ fresh consumption | |||
| Italy | Europanel | monthly volumes and values of households’ fresh consumption | Weekly section: monthly unit values are spread over the weeks of a given month |
| Monthly section: monthly volumes and values of households’ fresh consumption | |||
| Latvia | Centrala statistikas parvalde | Weekly retail prices | Weekly section: weekly retail prices as collected from Centrala statistikas parvalde |
| Lithuania | Valstybes imone Žemes ukio informacijos ir kaimo verslo centras | Weekly retail prices | Weekly section: weekly retail prices as collected from the Valstybes imone Žemes ukio informacijos ir kaimo verslo centras |
| Netherlands | Europanel | monthly volumes and values of households’ fresh consumption | Weekly section: monthly unit values are spread over the weeks of a given month |
| Monthly section: monthly volumes and values of households’ fresh consumption | |||
| Poland | Glówny Urzad Statystyczny | monthly retail prices | Weekly section: monthly prices are spread over the weeks of a given month |
| Europanel | monthly volumes and values of households’ fresh consumption | Monthly section: monthly volumes and values of households’ fresh consumption | |
| Portugal | Europanel | monthly volumes and values of households’ fresh consumption | Weekly section: monthly unit values are spread over the weeks of a given month |
| Monthly section: monthly volumes and values of households’ fresh consumption | |||
| Spain | Ministerio de Agricultura y Pesca, Alimentación y Medio Ambiente | weekly retail prices | Weekly section: weekly retail prices as collected from the Ministerio de Agricultura y Pesca, Alimentación y Medio Ambiente |
| Europanel | monthly volumes and values of households’ fresh consumption | Monthly section: monthly volumes and values of households’ fresh consumption | |
| United Kingdom | Europanel | monthly volumes and values of households’ fresh consumption (till January 2020) | Weekly section: monthly unit values are spread over the weeks of a given month |
| Monthly section: monthly volumes and values of households’ fresh consumption |
Yearly data on apparent consumption are calculated by using the supply balance sheet, which is based on the equation: Apparent consumption = [(total catches - industrial catches) + aquaculture + imports] - exports. Sources of data are:
- For catches, EUROSTAT
- For aquaculture, EUROSTAT, Member States' administrations, FAO and FEAP
- For import-export, EUROSTAT-COMEXT